
In Celebration with the annual Open Data Week, Civic Tech DC is partnering with the Office of the Chief Technology Officer (OCTO) to host the Open Data DC Showcase 2025, a celebration of Open Data DC and other public datasets about the District.
On Wednesday, March 26th, we're inviting local data practitioners, data journalists, and university students to give 10-minute lightning talks on how they've used Open Data DC or other publicly available datasets to solve city problems, tell compelling stories, or build helpful tools.

Founded in 2012, Civic Tech DC is a non-partisan, non-political group of volunteer civic hackers working together to solve local issues and help people engage with the city.
OCTO's mission is to direct the strategy, deployment, and management of DC Government technology with an unwavering commitment to IT excellence, efficiency, and value for government, residents, businesses, and visitors.

Our venture sponsor is Morning Consult, a global decision intelligence company changing how modern leaders make smarter, faster, better decisions. The company pairs its proprietary high-frequency data with applied artificial intelligence to better inform decisions on what people think and how they will act.
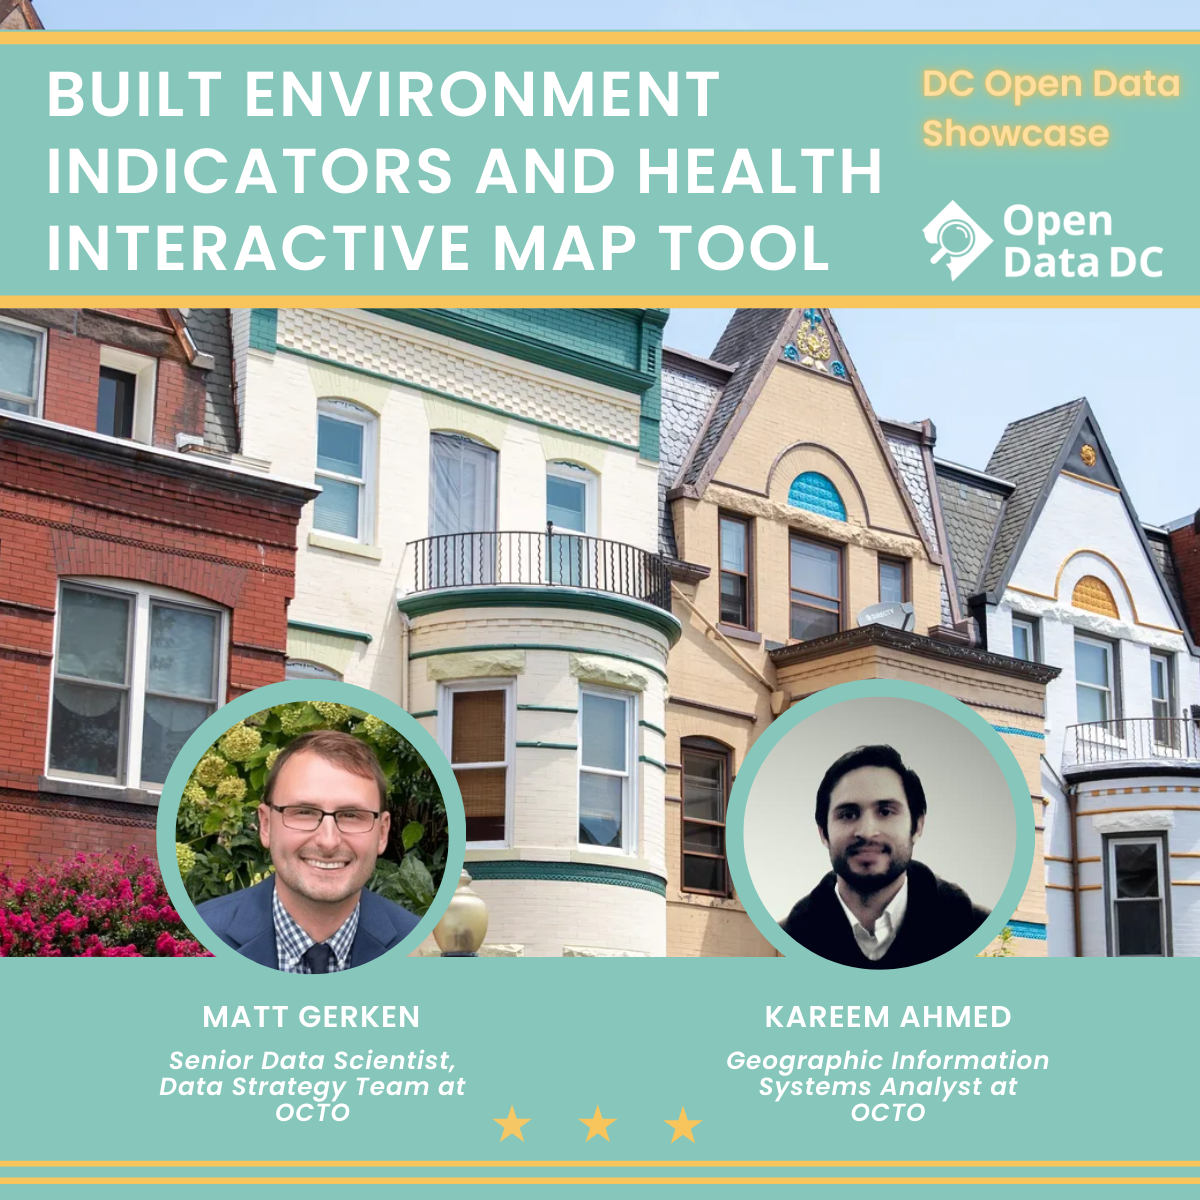
Originally built at a DC government hackathon, this tool analyzes 41 key measures across nine critical drivers - housing, transportation, and healthcare - using 48 datasets from Open Data DC. In Built Environment Indicators and Health Interactive Map Tool, Matthew Gerken and Kareem Ahmed explore how this tool helps policymakers, community groups, and residents make data-driven, more equitable decisions.
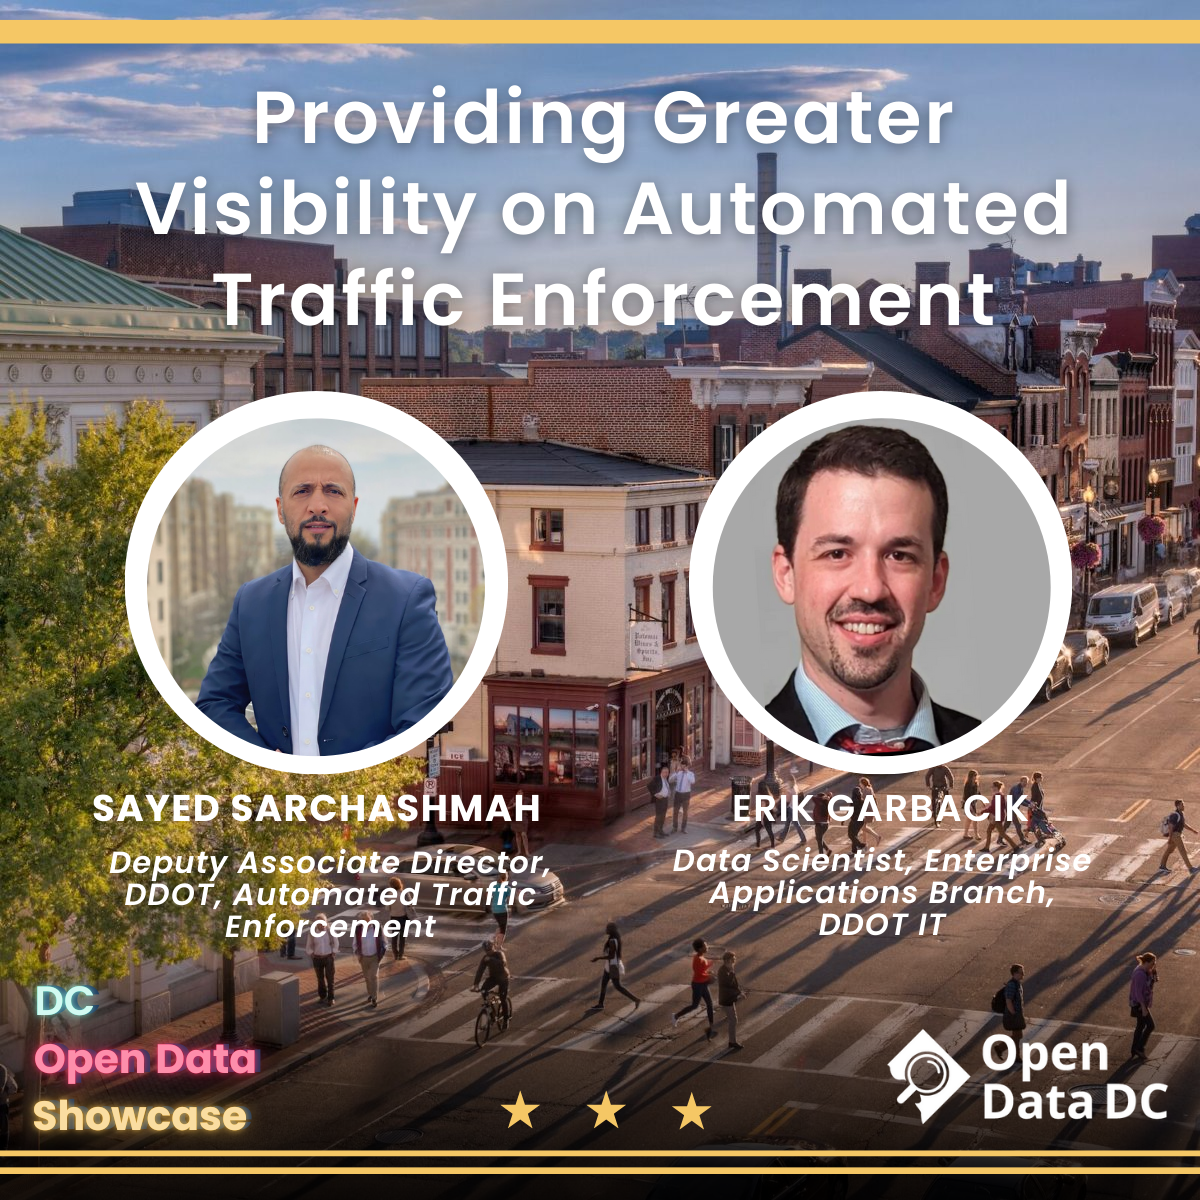
DDOT's Automated Traffic Enforcement (ATE) program enhances road safety by reducing traffic-related fatalities and injuries as part of Vision Zero. In Providing Greater Visibility on Automated Traffic Enforcement, Sayed Sarchashmah and Erik Garbacik show how by using OpenDataDC’s geospatial data and ATE camera insights, DDOT can provide real-time locations, enforcement statuses, and performance metrics.
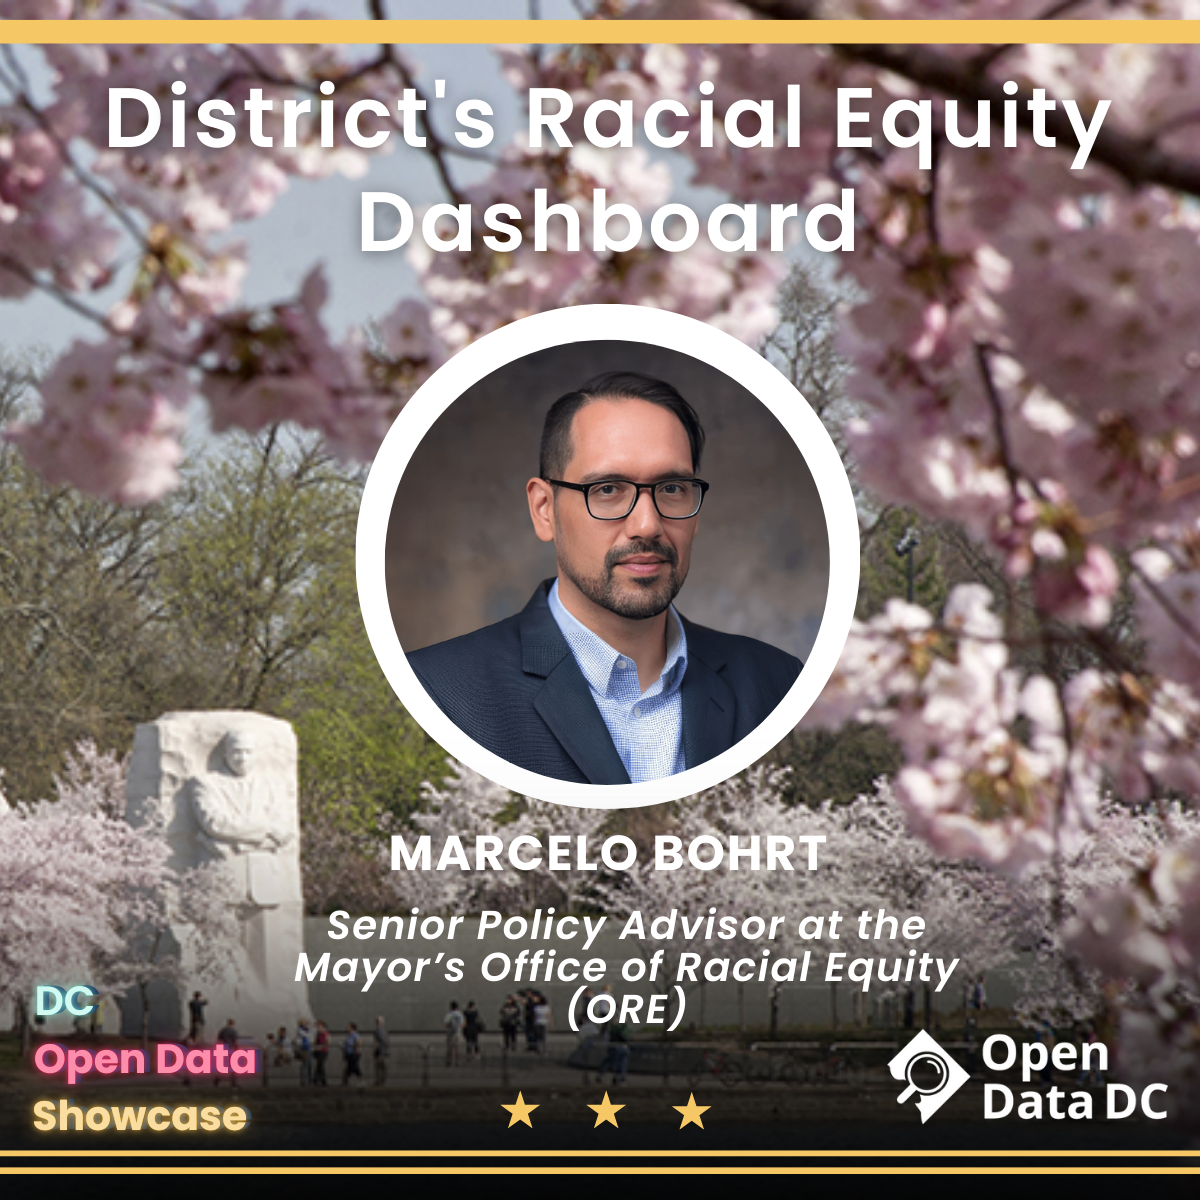
D.C. Racial Equity Dashboard is a comprehensive, user-friendly online platform that brings together federal and local data on 32 key indicators of racial equity across seven dimensions of life in our city. In District’s Racial Equity Dashboard, Marcelo Bohrt demonstrates how the tool, built with 18+ datasets, prioritizes disaggregated data and user-centered design to ensure accessibility.
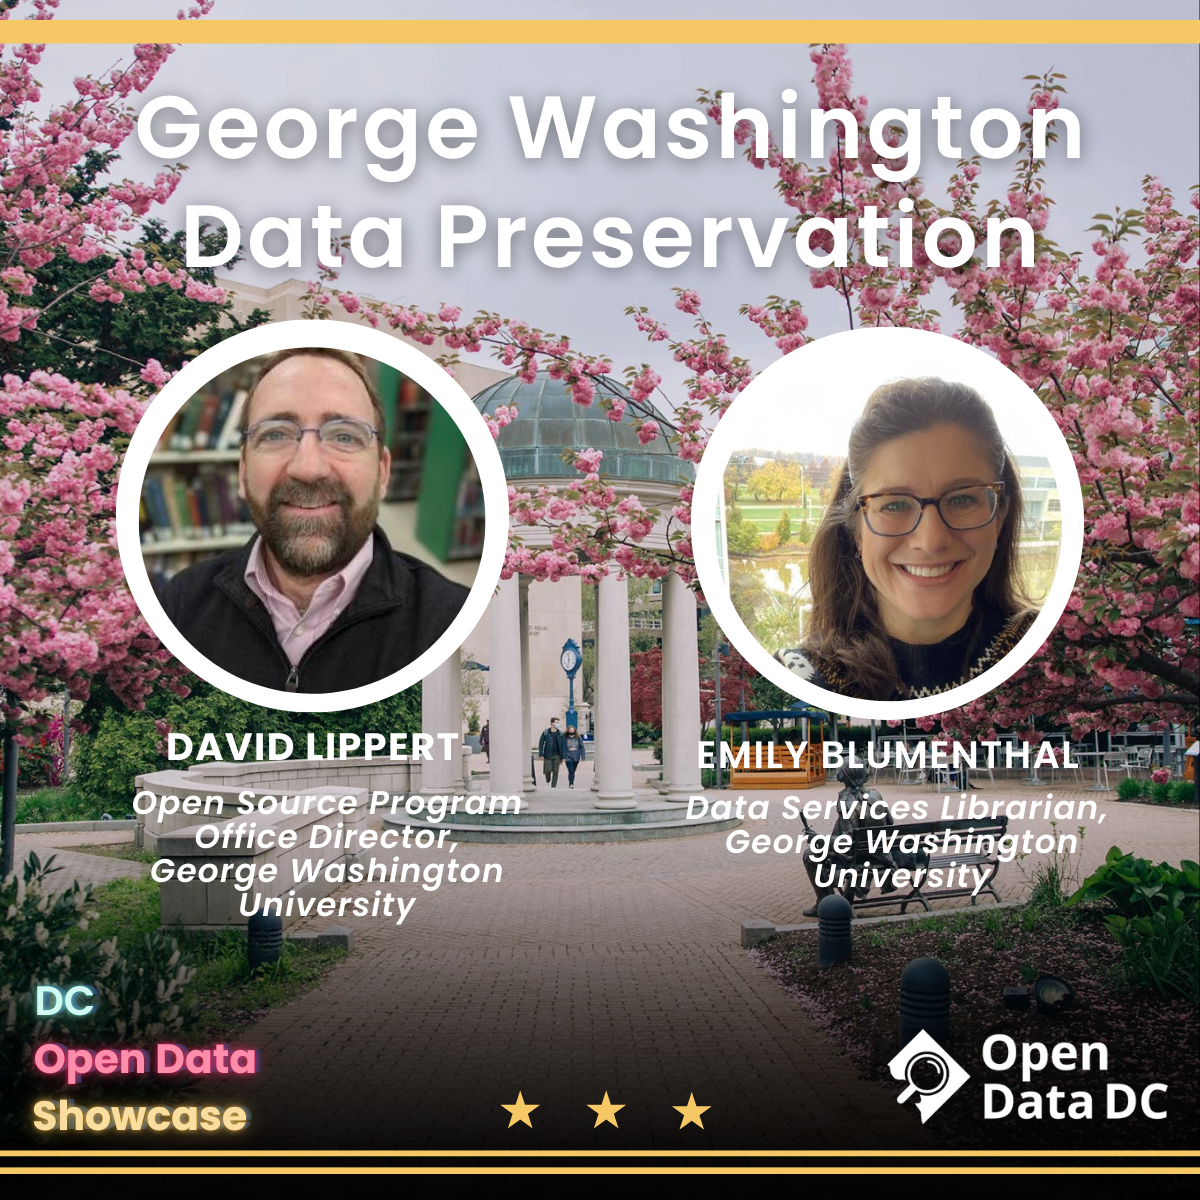
Data drives decisions—but what happens when critical datasets disappear? The loss of essential data can disrupt public services, erode trust, and impact effective policymaking. In GW Data Preservation, David Lippert and Emily Blumenthal explore the challenges of data loss and the ongoing efforts from George Washington University to rescue vital datasets.

D.C. has significantly expanded its automated traffic enforcement (ATE) program, doubling the number of speeding cameras in recent years. In Smile, You’re on Camera: A Deep Dive on Automated Traffic Enforcement Data, Pete Rodrigue explores that while ATE cameras do reduce speeding over time, they work best alongside broader road design improvements where infrastructure updates could support pedestrian safety.
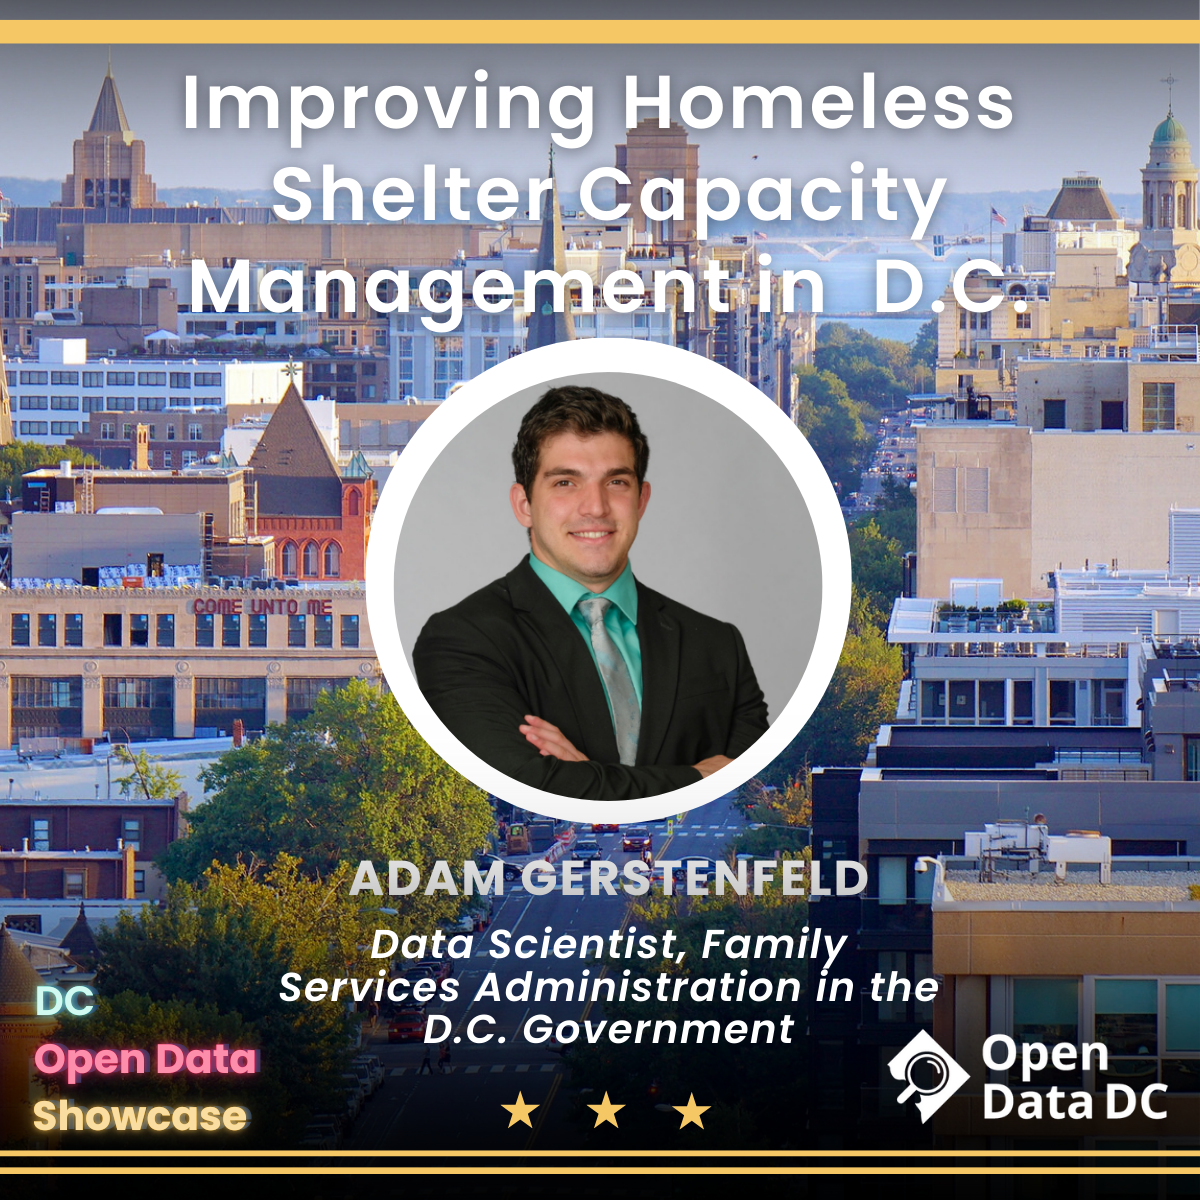
D.C. has transformed shelter bed management by leveraging Survey123, Operations Dashboard, and the ArcGIS Python API to provide real-time data to shelter transportation employees. In Improving Homeless Shelter Capacity Management in Washington, D.C., Adam Gerstenfeld talks about how open data and GIS partnerships are revolutionizing dashboarding and operational capabilities.
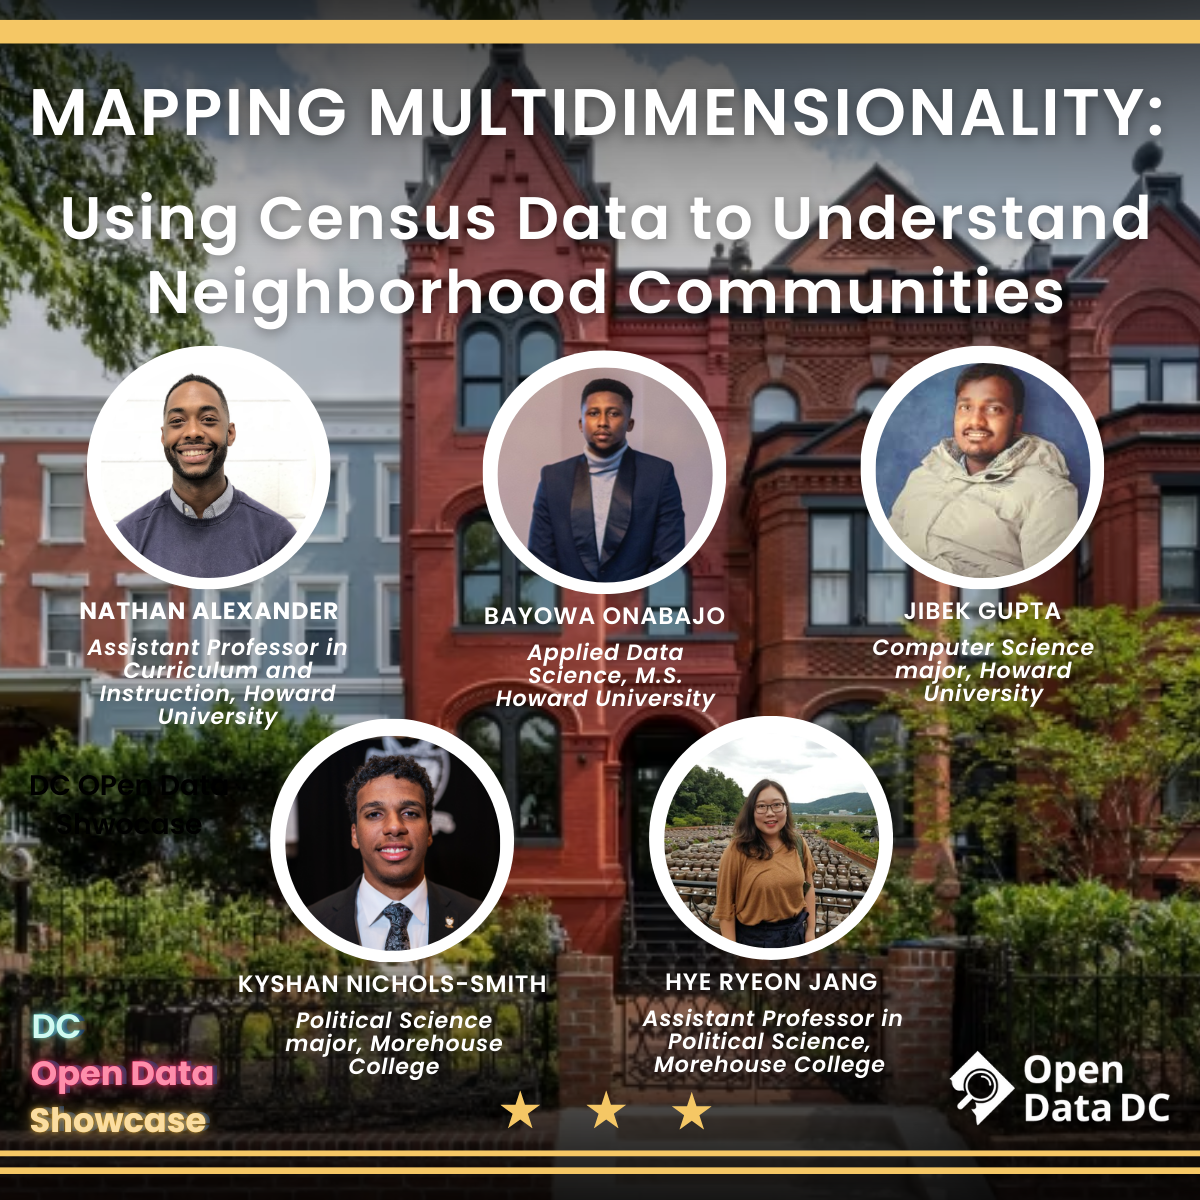
Examining Census Community Resilience Estimates (CREs) alongside other open data sources can shed light on overlooked patterns of structural inequity and social isolation. In Mapping Multidimensionality: Using Census Data to Understand Neighborhood Communities” Bayowa Onabajo MBChB, Jibek Gupta, Kyshan Nichols-Smith, and Professors Nathan Alexander and Hye Ryeon (Helen) Jang demonstrate how a mixed-methods approach can guide targeted interventions.