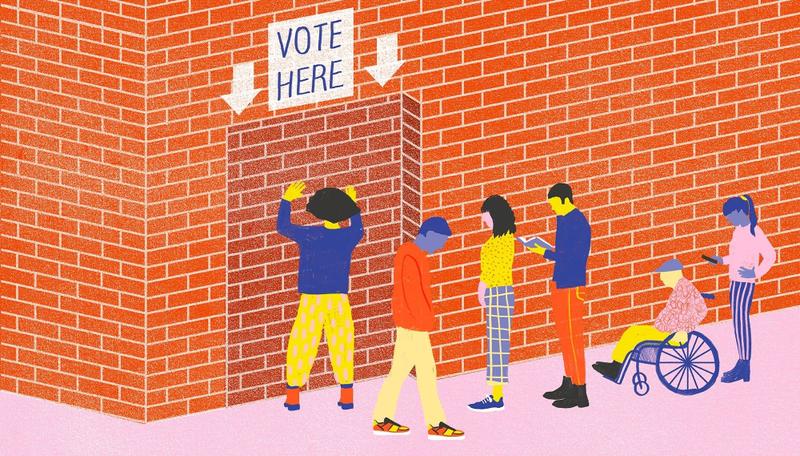
By using data from the biennial Election Administration and Voting Survey, we can identify trends and outliers in voter registration, voter roll maintenance, mail ballots, and other aspects of U.S. elections.
We're bridging this gap with a tool that:
Join us to help detect and deter vote suppression and fraud! By assisting the Campaign Legal Center identify outliers in voter registration and votes, we enable their attorneys to take action against any wrongdoing that may be causing the anomalies.
DMV-based, but designed to be open source and replicable across the country. The Campaign Legal Center wants to identify states and counties that suspicious patterns in voter registration or voting, so it can take legal action to remedy the problems. For example, one state had an unusually high rate of rejection for voter registration applications submitted at public service offices, which turned out to be because of a glitch in the self-service kiosks used at public service offices in that state. The current process the Campaign Legal Center uses is identifying the variables that interest them in the EAVS raw data file and codebook. Then they copy and paste the relevant columns into a new Excel spreadsheet. In order to calculate the voter registration rejection rates they are interested in, they use Excel formulas (for example, dividing the column that contains the number of applications rejected by the sum of the column that contains the number of applications accepted and the column that contains the number of applications rejected). Then they use the Excel subtotal feature to aggregate the data by state, since the raw data is only presented by county (although one of their interns wrote an R script to add up the county totals to get state totals). If they want to calculate how rates have changed, they copy and paste the relevant columns from the Excel spreadsheets they made for previous surveys into the current year spreadsheet. One of the major pain points is that all of this copying and pasting, aside from being labor-intensive, can result in human error. Also, it is difficult for the Campaign Legal Center attorneys to find what they are looking for in the Excel spreadsheet. Thus, the Campaign Legal Center needs Civic Tech volunteers to help them with data analysis and visualization. Everyone is welcome, no matter your skill level or background. We especially need help with:🏠 Why This Matters
🚀 Our Impact
🌍 Geography / Reach
🤝 Community Partners
Campaign Legal Center + Nonprofit
📖 Our Story
👋 Come Join Us